Product docs and API reference are now on Akamai TechDocs.
Search product docs.
Search for “” in product docs.
Search API reference.
Search for “” in API reference.
Search Results
results matching
results
No Results
Filters
Monitoring NGINX Using the Elastic Stack on CentOS 7
Traducciones al EspañolEstamos traduciendo nuestros guías y tutoriales al Español. Es posible que usted esté viendo una traducción generada automáticamente. Estamos trabajando con traductores profesionales para verificar las traducciones de nuestro sitio web. Este proyecto es un trabajo en curso.


What is the Elastic Stack?
The Elastic Stack is a set of open-source tools that aid in analyzing different types of data. Tools such as Filebeat and Metricbeat can collect system and webserver logs and send them to Elasticsearch where the data can be searched, analyzed, and visualized using Kibana as a browser-based application.
This guide will explain how to install different components of the stack in order to monitor a typical webserver. It will use version 6 of each of the tools in the Elastic Stack, which is a recent release featuring additional features and fixes.
sudo. If you’re not familiar with the sudo command, you can check our Users and Groups guide.Before You Begin
If you have not already done so, create a Linode account and Compute Instance. See our Getting Started with Linode and Creating a Compute Instance guides.
Follow our Setting Up and Securing a Compute Instance guide to update your system. You may also wish to set the timezone, configure your hostname, create a limited user account, and harden SSH access.
Follow the steps in our Install a LEMP Stack on CentOS 7 with FastCGI guide to set up a web server stack with NGINX on your CentOS host.
Install OpenJDK 8
Elasticsearch requires recent versions of Java. On CentOS 7, OpenJDK 8 is available for installation from the official repositories.
Install the headless OpenJDK package:
sudo yum install -y java-1.8.0-openjdk-headlessEnsure that Java is ready for use by Elasticsearch by checking that the installed version is at least at version 1.8.0:
java -versionThe installed version should be similar to the following:
openjdk version "1.8.0_151"
OpenJDK Runtime Environment (build 1.8.0_151-b12)
OpenJDK 64-Bit Server VM (build 25.151-b12, mixed mode)
Install Elastic Yum Repository
The Elastic Yum package repository contains all the necessary packages for the remainder of this tutorial.
Trust the Elastic signing key:
sudo rpm --import https://artifacts.elastic.co/GPG-KEY-elasticsearchCreate a yum repository configuration to use the Elastic yum repository:
- File: elastic.repo
1
2
3
4
5
6
7
8
[elasticsearch-6.x] name=Elastic repository for 6.x packages baseurl=https://artifacts.elastic.co/packages/6.x/yum gpgcheck=1 gpgkey=https://artifacts.elastic.co/GPG-KEY-elasticsearch enabled=1 autorefresh=1 type=rpm-md
Update the
yumcache to ensure any new packages become available:sudo yum update
Install Stack Components
This tutorial will use several parts of the Elastic Stack for log analysis and machine metrics. Before starting, it may be helpful to summarize how each piece will help form the final stack of software:
- Filebeat will watch and collect web server access logs from NGINX. Filebeat will also manage configuring Elasticsearch to ensure logs are parsed as expected and loaded into the correct indices.
- Metricbeat will collect system metrics such as CPU, memory, and disk usage, and store this as numerical data in Elasticsearch.
- Elasticsearch will store logs and metrics sent to it from each Beat. Documents are indexed for searching and available over the default Elasticsearch port (9200).
- Kibana will connect to Elasticsearch to expose indexed documents in a searchable, browser-based visualization interface.
Elasticsearch
In order to provide a datastore for each Beat and Kibana, Elasticsearch must first be installed and configured.
Install the
elasticsearchpackage:sudo yum install -y elasticsearchSet the JVM heap size to approximately half of your server’s available memory. For example, if your server has 1GB of RAM, change the
XmsandXmxvalues in the/etc/elasticsearch/jvm.optionsfile512m. Leave the other values in this file unchanged:- File: /etc/elasticsearch/jvm.options
1 2-Xms512m -Xmx512m
In order for Filebeat to properly parse and process certain documents, two ingest plugins must be installed for elasticsearch. First, install the
ingest-user-agentplugin, which enables Elasticsearch to accurately parse user-agent strings:sudo /usr/share/elasticsearch/bin/elasticsearch-plugin install ingest-user-agentNext, install the geoip processor plugin. The
elasticsearch-plugincommand may ask for confirmation to make changes to the/etc/elasticsearchpath, which is safe to do:sudo /usr/share/elasticsearch/bin/elasticsearch-plugin install ingest-geoipStart and enable the
elasticsearchservice:sudo systemctl enable elasticsearch sudo systemctl start elasticsearchWait a few moments for the service to start, then confirm that the Elasticsearch API is available:
curl localhost:9200Elasticsearch may take some time to start up. If you need to determine whether the service has started successfully or not, you can use the
systemctl status elasticsearchcommand to see the most recent logs. The Elasticsearch REST API should return a JSON response similar to the following:{ "name" : "Q1R2Oz7", "cluster_name" : "elasticsearch", "cluster_uuid" : "amcxppmvTkmuApEdTz673A", "version" : { "number" : "6.0.0", "build_hash" : "8f0685b", "build_date" : "2017-11-10T18:41:22.859Z", "build_snapshot" : false, "lucene_version" : "7.0.1", "minimum_wire_compatibility_version" : "5.6.0", "minimum_index_compatibility_version" : "5.0.0" }, "tagline" : "You Know, for Search" }
Filebeat
Install the filebeat package:
sudo yum install filebeat
Metricbeat
Install the metricbeat package:
sudo yum install metricbeat
Kibana
Install the kibana package:
sudo yum install kibana
Configure The Stack
Elasticsearch
By default, Elasticsearch will create five shards and one replica for every index that’s created. When deploying to production, these are reasonable settings to use. In this tutorial, only one server is used in the Elasticsearch setup, so multiple shards and replicas are unnecessary. Changing these defaults can avoid unnecessary overhead.
Create a temporary JSON file with an index template that instructs Elasticsearch to set the number of shards to one and number of replicas to zero for all matching index names (in this case, a wildcard
*):- File: template.json
"template": "*",
"settings":
"index":
"number_of_shards": 1,
"number_of_replicas": 0
Use
curlto create an index template with these settings that’ll be applied to all indices created hereafter:curl -H'Content-Type: application/json' -XPUT http://localhost:9200/_template/defaults -d @template.jsonElasticsearch should return:
{"acknowledged":true}
Kibana
Enable and start the Kibana service:
sudo systemctl enable kibana
sudo systemctl start kibana
In order to securely access Kibana, this guide will use an SSH tunnel to access the web application. This avoids opening Kibana on a publicly accessible IP address and port.
By default, Kibana will be listening for requests from its local address only. In order to view Kibana in a local browser, issue the following command in a new terminal window:
ssh -L 5601:localhost:5601 username@<Linode public IP> -N
Replace username with your Linux user name and <Linode public IP> with the public IP address of your Linode.
Filebeat
Filebeat version 6 ships with the ability to use modules in order to automate how logs are collected, indexed, and visualized. This guide will use the NGINX module in order to handle most of the necessary configuration in order to instruct the stack how to process system logs.
Using a text editor, create
/etc/filebeat/filebeat.ymland add the following content:- File: /etc/filebeat/filebeat.yml
1 2 3 4 5 6 7 8 9 10filebeat.config.modules: path: ${path.config}/modules.d/*.yml setup.kibana: host: "localhost:5601" output.elasticsearch: hosts: ["localhost:9200"] setup.dashboards.enabled: true
You can enable Filebeat modules by removing
.disabledfrom the file names. Enable the NGINX module:sudo mv /etc/filebeat/modules.d/nginx.yml.disabled /etc/filebeat/modules.d/nginx.ymlEnable and start the
filebeatservice:sudo systemctl enable filebeat sudo systemctl start filebeat
Metricbeat
Like Filebeat, Metricbeat also provides a variety of built-in modules to help configure itself to monitor different aspects of the host system automatically. The following steps will configure Metricbeat to use these features and enable the system service.
- Create the following Metricbeat configuration:
- File: /etc/metricbeat/metricbeat.yml
1 2 3 4 5 6 7 8 9 10metricbeat.config.modules: path: ${path.config}/modules.d/*.yml setup.kibana: host: "localhost:5601" output.elasticsearch: hosts: ["localhost:9200"] setup.dashboards.enabled: true
Rename the Elasticsearch, Kibana, and NGINX module configuration files in order to enable them:
sudo mv /etc/metricbeat/modules.d/elasticsearch.yml.disabled /etc/metricbeat/modules.d/elasticsearch.yml
sudo mv /etc/metricbeat/modules.d/kibana.yml.disabled /etc/metricbeat/modules.d/kibana.yml
sudo mv /etc/metricbeat/modules.d/nginx.yml.disabled /etc/metricbeat/modules.d/nginx.yml
Start and enable the
metricbeatservice:sudo systemctl enable metricbeat sudo systemctl start metricbeat
Creating and Using Visualizations
The rest of this guide will use Kibana’s browser-based interface in order to view and search machine data.
Although Filebeat is now monitoring NGINX access and error logs, traffic must be generated to create data to visualize in Kibana. Run the following command in another terminal window or tab in order to generate webserver requests in the background:
while true ; do n=$(( RANDOM % 10 )) ; curl "localhost/?$n" ; sleep $n ; doneThis process may be terminated by entering Ctrl-C at the terminal to exit the request loop at the conclusion of this tutorial.
Open Kibana by navigating to
http://localhost:5601in a browser to access the SSH-forwarded port. The landing page should look similar to the following: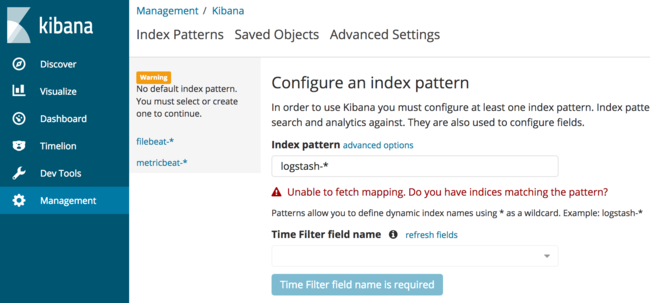
The interface asks for a default index pattern, which can be selected from the left sidebar. This will instruct Kibana to use the documents that either Filebeat or Metricbeat have indexed by default when presenting search dashboards. Click on
filebeat-*in order to view the Filebeat index pattern.From this screen, select the star icon to choose
filebeat-*as the default index pattern.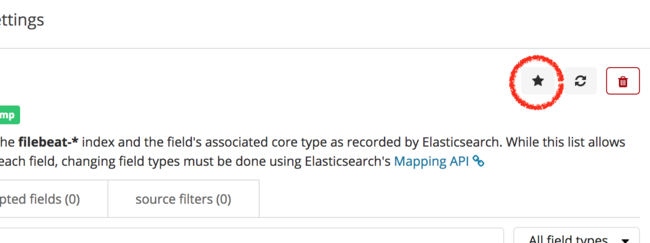
Click on “Discover” from the far left sidebar in order to view logs that are being indexed by Filebeat. A screen similar to the one shown below should appear:
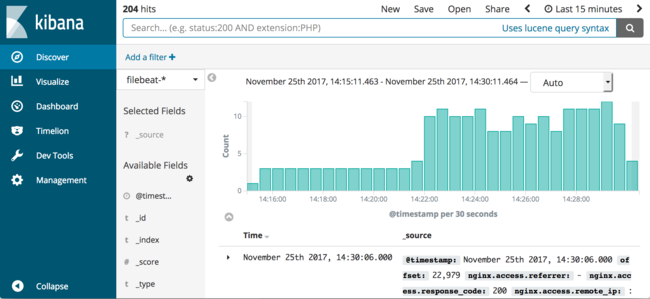
From this screen, logs can be easily searched and analyzed. For example, to search the NGINX access logs for all requests for
/?5that are being generated by the running shell loop in the background, enter the following into the search box and click the magnifying glass or hit Enter:nginx.access.url:"/?5"The interface will perform an Elasticsearch query and show only matching documents.
Filebeat Dashboards
In addition to collecting NGINX access logs, Filebeat also installs several dashboards into Kibana in order to provide useful default visualizations for your data.
From the “Discover” screen, select the “Dashboard” item from the sidebar menu.
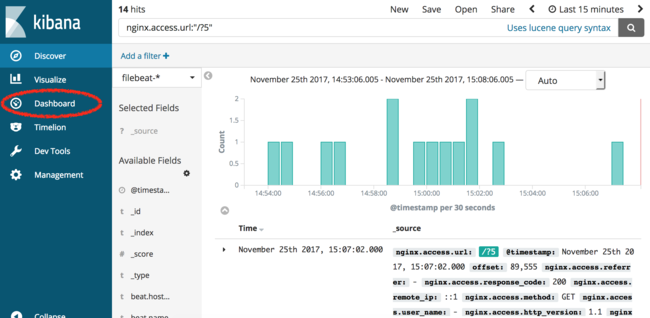
The following screen will appear, which lists all dashboards available to Kibana.
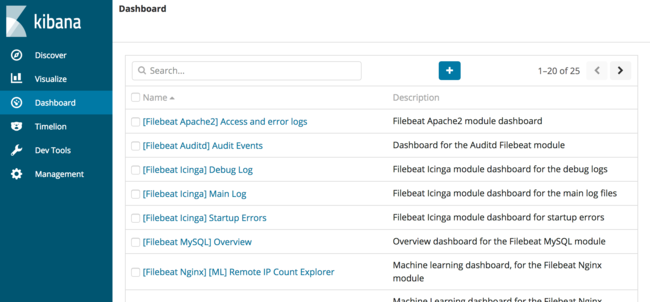
In the search box, enter “nginx” to search for all NGINX dashboards. In the list of results, select the dashboard titled “[Filebeat Nginx] Access and error logs”. The following dashboard will load:
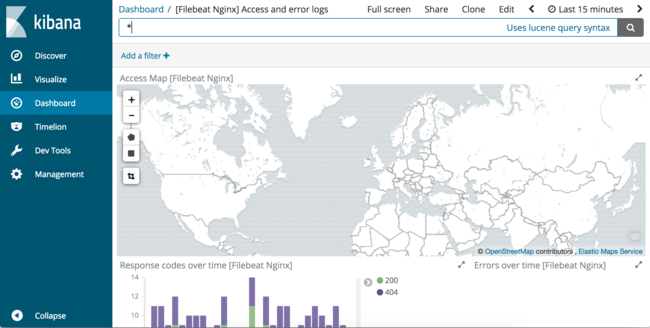
Scroll further down to view the visualizations available in this default dashboard. There are several virtualizations including a geolocation map, response codes by URL, and user-agent summaries. These dashboards can help summarize traffic to a webserver in addition to debugging issues. For example, when the Metricbeat NGINX module was enabled, we did not enable the NGINX server-status endpoint for use with Metricbeat. This dashboard can help find this misconfiguration.
To begin, scroll to the “Response codes over time” visualization in this dashboard. Observe that there are many 404 responses and click on one of the color-coded 404 bars:
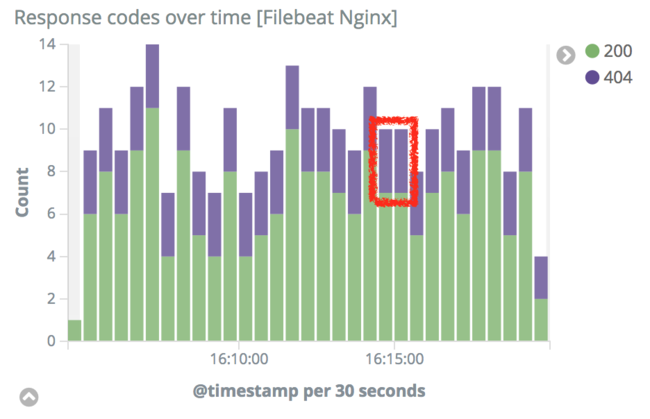
Scroll to the top of the Kibana interface and click the “Apply Now” button to filter the access logs only for logs that returned 404 to the user.

After applying this filter, scroll down again to view the visualizations for all 404 logs. Observe that “Response codes by top URLs” visualization indicates that NGINX is only returning 404 response codes for the
/server-statusurl: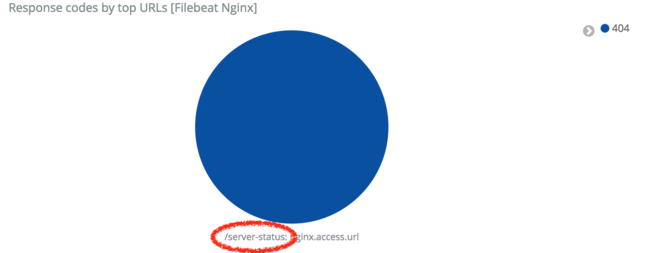
We can now fix the NGINX configuration to resolve this error.
Reconfiguring NGINX
Open the
/etc/nginx/nginx.conffile and add the followinglocationblock in between theincludeandlocation /lines:- File: /etc/nginx/nginx.conf
 1
 2
 3
 4
 5
 6
 7
 8
 9
10
11
12
include /etc/nginx/default.d/*.conf; location /server-status { stub_status on access_log off; allow 127.0.0.1; allow ::1; deny all; } location / { }
Restart NGINX:
sudo systemctl restart nginxRepeat the steps in the preceding section in order to observe response code history. 404 response codes should gradually stop appearing as you perform fresh searches in Kibana to view new logs.
Metricbeat
In addition to web server access logs, host metrics can be viewed in Kibana by using visualizations created by Metricbeat.
From the left-hand sidebar, select “Dashboard” and enter “metricbeat” in the search box to filter for Metricbeat dashboards. Select the dashboard named “[Metricbeat System] Overview”. A new dashboard should open with visualizations similar to the following:
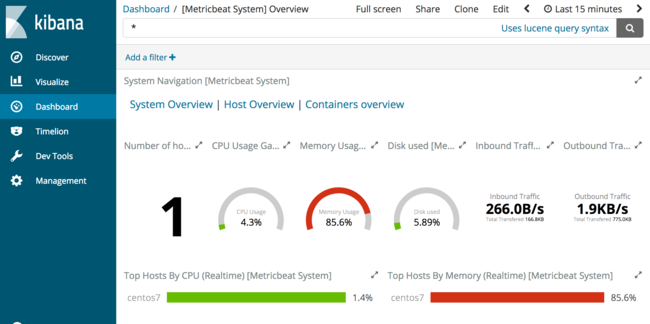
This dashboard provides a high-level overview of host metrics including CPU, memory, disk, and network use. If you install Metricbeat on any additional hosts and send metrics to a central Elasticsearch instance, Kibana provides a centralized monitoring view for a fleet of individual hosts. From this dashboard, select “Host Overview” from the “System Navigation” section of the dashboard.
From this dashboard, scroll down to view all of the host data being collected by Metricbeat. These visualizations provide a wealth of information.
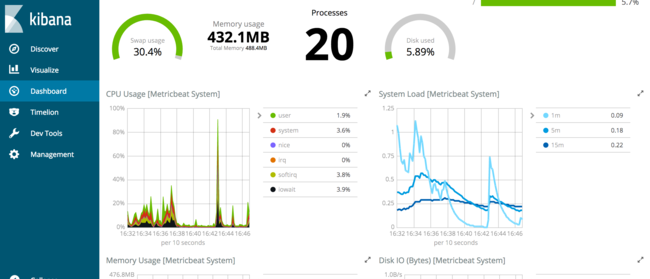
These dashboards are a sample of the types of machine metrics collected by Metricbeat. By using the collected metrics for datasets such as load, memory, and process resource usage, useful dashboards can be created for high-level overviews of servers.
Further Reading
This tutorial has covered only a portion of the data available for searching and analysis that Filebeat and Metricbeat provide. By drawing upon existing dashboards for examples, additional charts, graphs, and other visualizations can be created to answer specific questions and provide useful dashboards for a variety of purposes.
Comprehensive documentation for each piece of the stack is available from the Elastic web site:
- The Elasticsearch reference contains additional information regarding how to operate Elasticsearch, including clustering, managing indices, and more.
- Metricbeat’s documentation provides additional information regarding configuration options and modules for other projects such as Apache, MySQL, and more.
- The Filebeat documentation is useful if additional logs need to be collected and processed outside of the logs covered in this tutorial.
- Kibana’s documentation pages provide additional information regarding how to create useful visualizations and dashboards.
More Information
You may wish to consult the following resources for additional information on this topic. While these are provided in the hope that they will be useful, please note that we cannot vouch for the accuracy or timeliness of externally hosted materials.
This page was originally published on
