Product docs and API reference are now on Akamai TechDocs.
Search product docs.
Search for “” in product docs.
Search API reference.
Search for “” in API reference.
Search Results
results matching
results
No Results
Filters
Autoscaling on Linode using Prometheus
Abstract
This abstract provides a concrete example of how to autoscale a generic, highly available application runtime running on Compute Instances using Prometheus and a Jenkins CI/CD pipeline. For an introduction to CI/CD pipelines and use cases see Introduction to Continuous Integration and Continuous Delivery (CI/CD).
Cloud-based highly available workloads often need to scale horizontally when faced with periods of high demand, which can include traffic bursts based on marketing campaigns, new product launches, industry-based cyclical usage patterns, or unanticipated demand. Regardless of the reason, having the flexibility to reduce your costs when traffic is low, while also having the capability to expand your workload capacity on-demand, can be critical to customer satisfaction, your reputation, and your bottom line. This reference architecture demonstrates how to scale your workloads up or down within Akamai Cloud using Compute Instances hosting your application runtime.
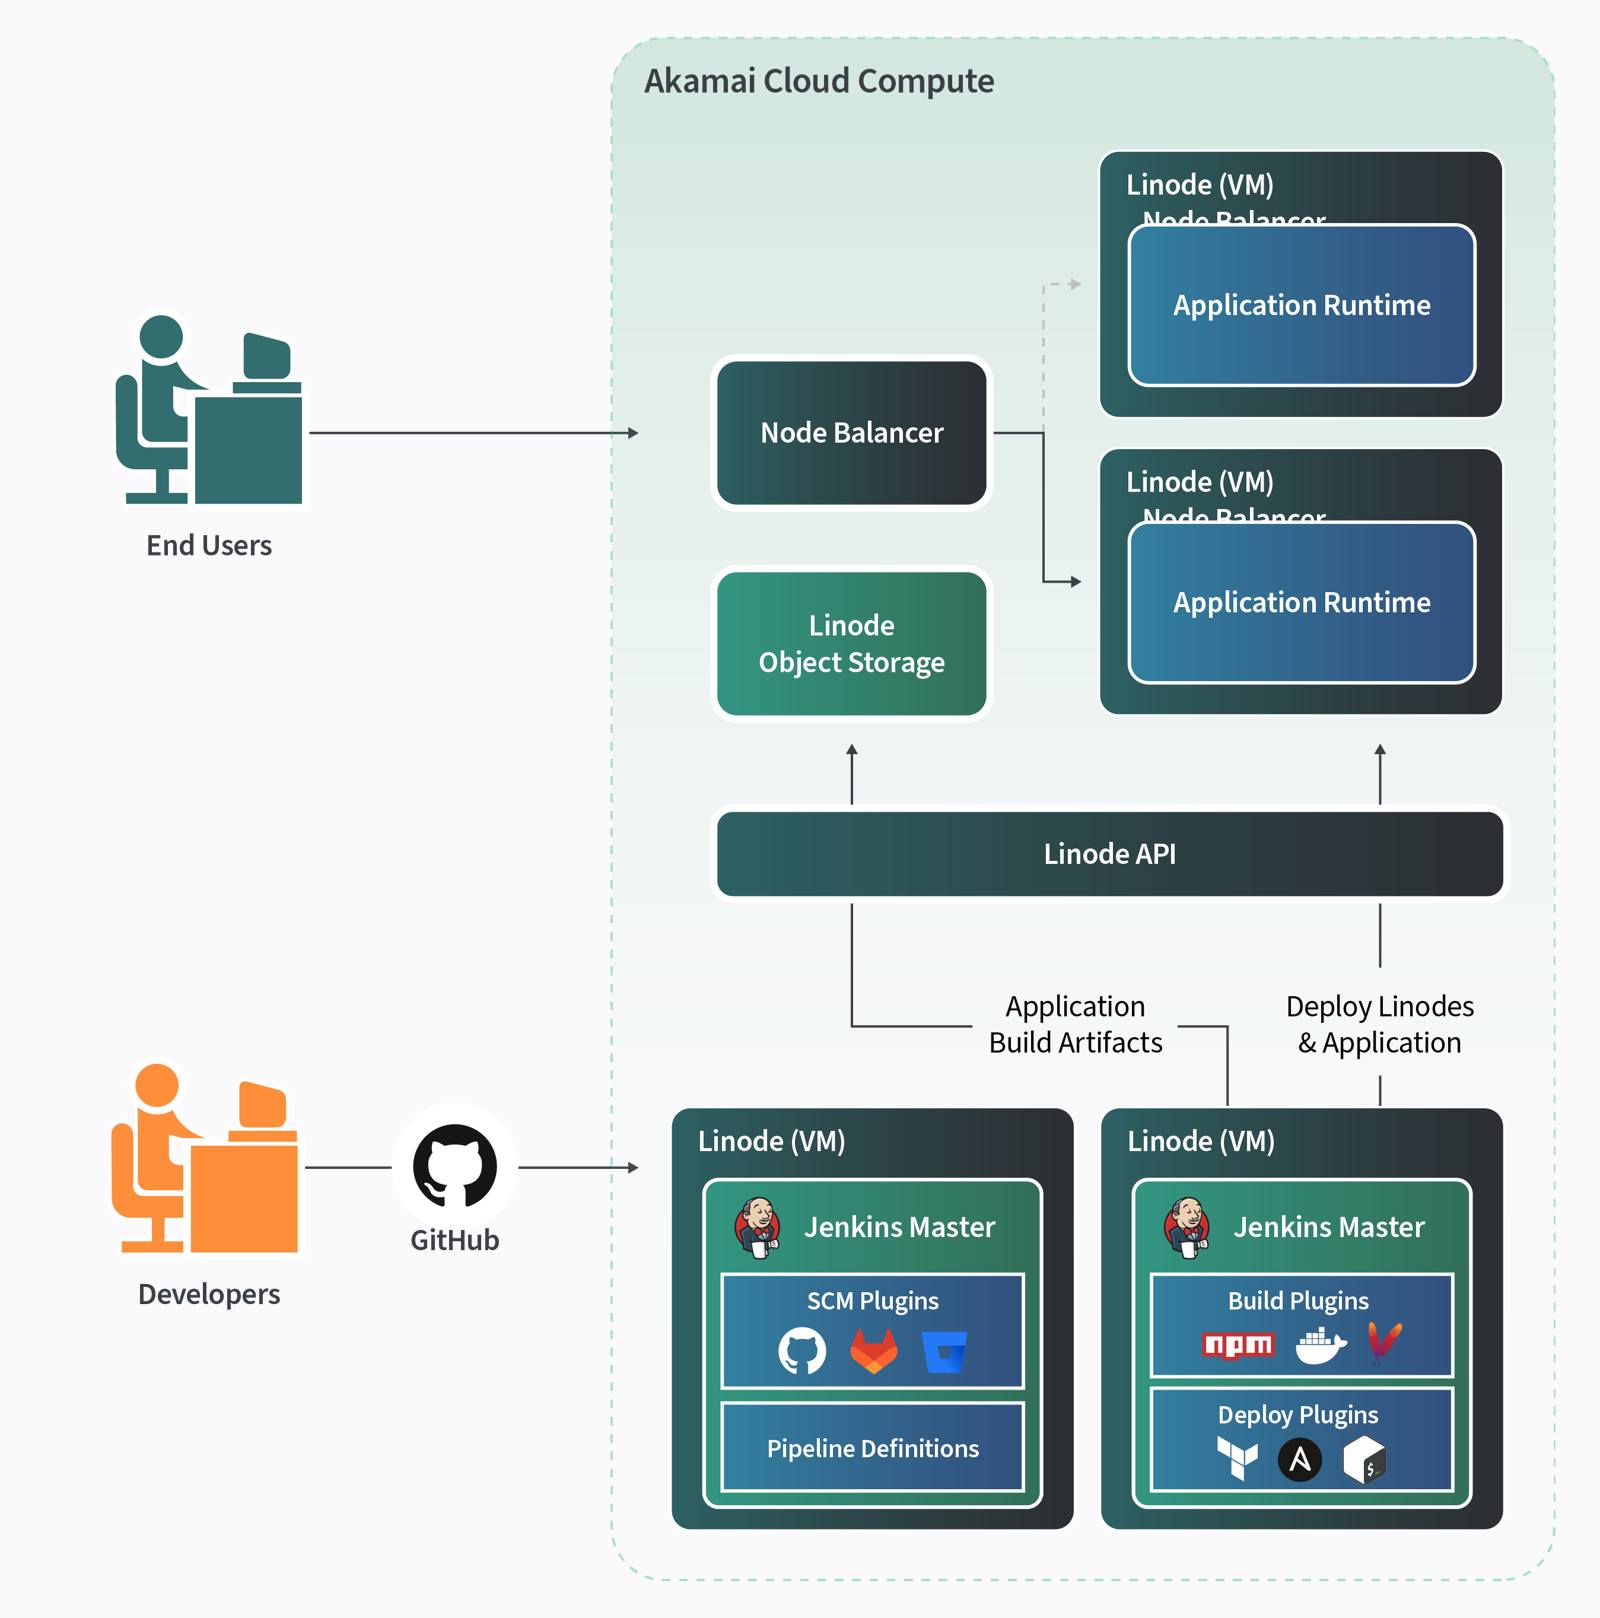
Figure 1: A Common Highly Available Application Architecture


Figure 1 illustrates a common highly available application runtime that includes a delivery pipeline for developers to build the application, integration with Linode API through our Terraform provider, Ansible community package, or Linode CLI. The system baseline illustrated here uses GitHub for source control management (although GitLab, Bitbucket, or other SCMs that Jenkins supports would work as well), Jenkins deployed on Compute Instances (Linode virtual machines), and using Object Storage as a artifact repository. For additional practical details on setting Jenkins up, see How to Automate Builds with Jenkins.
This use case assumes a web service deployed in a highly available configuration as shown in Figure 1, with at least two web servers behind a traffic manager. This example uses a NodeBalancer as a ingress proxy and Compute Instances for compute running the application. In summary, this baseline example illustrates the capability to maintain a typical application lifecycle with the tools shown.
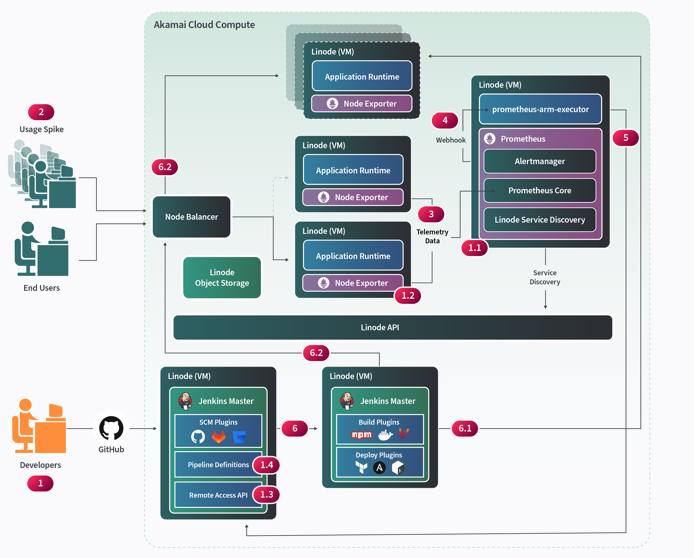
Figure 2: Auto-Scaling Application Architecture with Prometheus


Figure 2 illustrates a system architecture where data flow triggers the Compute Instances to automatically scale up or scale down. This auto scaling architecture introduces a tool called Prometheus to help monitor the system and trigger events that will ultimately be received by our CI/CD pipeline to help properly scale the system.
Prometheus is a metrics-based time series database (TSDB) monitoring system used by thousands of organizations to help observe the performance and health of their applications in real-time. In this scenario, assume that our application servers are CPU bound and the system needs to scale the application when a specific aggregate CPU threshold is surpassed.
By default, Prometheus provides the necessary tooling for this use case. A Node Exporter, which is a service that runs on the application nodes, is exposed on port 9100, and allows the Prometheus node to scrape telemetry data from them in regular intervals. Prometheus uses a built-in Linode integration that enables discovery of the nodes that it will regularly scrape. Using a defined metric, like a certain CPU threshold, Prometheus can trigger alerts, and use a webhook receiver to send the event to an open source executable service called prometheus-am-executor. This pattern can be extended to scale up or down the application instances, or a number of other deployment use cases by sending events to the Jenkins remote access API.
Figure 2 contains some numbered steps as a high level example of scale up flow and includes the following:
- Developers extend the baseline system from Figure 1 to enable the capabilities in Figure 2 by doing the following:
- Add a Prometheus node with Linode service discovery config, telemetry data mappings, alert manager configurations, and prometheus-am-executor as a startup process.
- Add Prometheus Node Exporter as a running service to the Application Server instances to collect system metrics.
- Enable the Jenkins remote access API so the prometheus-am-executor can communicate with it.
- Create a Jenkins Pipeline Definition to scale up the infrastructure when receiving events from prometheus-am-executor. Add the necessary code and setup to prometheus-am-executor to call the scale up pipeline on high CPU load events. Your scale up deployment script could use available tooling, such as Terraform, to stand up nodes and update the NodeBalancer. Additionally Ansible can set the desired state of configuration on standard images. Alternatively, a golden image already created in Linode, or the Linode API and StackScripts could create the horizontally scaled Compute Instances in the desired state to take on workloads.
With the setup above, the system should be ready to handle usage spikes that will trigger Prometheus to scale the system up and down
Figure 2 also contains an event and data flow that demonstrates the horizontal scaling capability in action.
- A usage spike could occur from concurrent requests from users or services that leverage this system.
- The CPU of the existing application servers will spike as well and telemetry data collected at regular intervals will be registered in Prometheus.
- When the CPU utilization surpasses the threshold metric configured in Alert Manager, it will trigger a webhook to prometheus-am-executor.
- The Jenkins API within the deployment tooling will receive this event and trigger the “scale up” deployment pipeline.
- The API will invoke the pipeline and the triggered deployment automation which will do the following:
- Deploy additional Compute Instances using custom scripts or deployment tools such as Terraform. The deployment flow can use an image with all dependencies already configured or deploy a standard Linode and use configuration management tools like Linode Stack Scripts or Ansible to achieve the node’s desired state.
- Update the NodeBalancer Backend Nodes registry and add the new nodes that have been created. The NodeBalancer will serve them requests when their health check has passed.
NOTE: When the traffic burst has subsided an Alter Manager event can also be kicked off to notify the system to scale down and can be handled similarly by the deployment tooling through prometheus-am-executor and Jenkins API with a configured pipeline for that use case.
Technologies Used
- Prometheus
- Jenkins
- GitHub
- Linode Technologies:
Business Benefits
- Infrastructure cost savings – manage workloads for anticipated periodic high usage scenarios using only what you need, when you need it.
- Increase customer satisfaction – being able to handle unanticipated high usage scenarios and maintain a high level of service will preserve your reputation and create stickiness with your customers.
- Increased innovation and agility – introducing additional automation into a system architecture frees up more time to focus on features and capabilities that will further differentiate the business and enable the business to adapt to market changes.
This page was originally published on

