Is this swap usage ok?
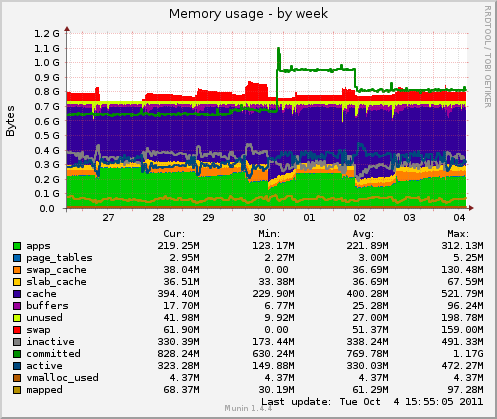
My VPS (768) is using some swap and I think something is not going well.
 ~~
~~
The jump green line is the swith from mysql to mariadb. The drop is the result of disabling some mariadb plugins/engines.
ps aux –sort -rss results:
USER       PID %CPU %MEM    VSZ   RSS TTY      STAT START   TIME COMMAND
mysql     2623  1.1 19.1 344004 147276 ?       Ssl  Oct02  35:00 /usr/sbin/mysqld
nobody   14230  0.1  4.9 673572 38012 ?        Sl   Oct03   1:39 /usr/sbin/varnishd -P /var/run/varnishd.pid -a :6081 -T localhost:6082 -f /etc/varnish/default.vcl -S /etc/varnish/secret -s file,/var/lib/varnish/sirius.hostname/varnish_storage.bin,500M
www-data 29041  4.0  4.3 237236 33436 ?        S    16:25   0:05 /usr/sbin/apache2 -k start
www-data 29044  4.6  4.1 237864 32220 ?        S    16:26   0:05 /usr/sbin/apache2 -k start
www-data 29088  2.7  3.5 236976 27148 ?        S    16:27   0:00 /usr/sbin/apache2 -k start
root      3972  0.0  2.3 200608 17948 ?        Ss   Sep21   1:54 /usr/sbin/apache2 -k start
www-data 29092  0.0  1.5 200608 11944 ?        S    16:27   0:00 /usr/sbin/apache2 -k start
root     14111  0.0  1.4 134364 11504 ?        S    06:25   0:00 /usr/sbin/apache2 -k start
root      2833  0.0  0.7  17284  5876 ?        Ss   Sep10  17:14 lfd - sleeping
prosody   2951  0.0  0.5   8680  4256 ?        S    Sep10   4:40 lua /usr/bin/prosody
postfix  29087  0.0  0.4   6472  3288 ?        S    16:27   0:00 smtpd -n smtp -t inet -u -c -o stress=
postfix  29049  0.0  0.4   6440  3216 ?        S    16:26   0:00 smtpd -n smtp -t inet -u -c -o stress=
root      4182  0.0  0.3   6976  2684 ?        Ss   Oct02   2:02 /usr/sbin/cloudkick-agent --daemon -c /etc/cloudkick.conf -p /var/run/cloudkick-agent.pid
root     29055  0.1  0.3   8384  2640 ?        Ss   16:26   0:00 sshd: nuno [priv]
www-data 14270  0.0  0.3  12448  2592 ?        S    Oct03   0:21 nginx: worker process
www-data 14269  0.0  0.3  12380  2560 ?        S    Oct03   0:20 nginx: worker process
postfix  29082  0.0  0.3   6108  2400 ?        S    16:27   0:00 local -t unix
www-data 14268  0.0  0.3  12392  2360 ?        S    Oct03   0:22 nginx: worker process
107       2825  0.0  0.3  68708  2332 ?        Ssl  Sep10   1:30 /usr/sbin/dkim-filter -x /etc/dkim-filter.conf -u dkim-filter -P /var/run/dkim-filter/dkim-filter.pid -p inet:8891@localhost
www-data 14267  0.0  0.3  12360  2308 ?        S    Oct03   0:22 nginx: worker process
root     31516  0.0  0.2   7740  2104 ?        Ss   Sep30   0:23 /usr/sbin/munin-node
postfix  29083  0.0  0.2   6040  2092 ?        S    16:27   0:00 smtp -t unix -u -c
postfix  29080  0.0  0.2   6108  2088 ?        S    16:27   0:00 cleanup -z -t unix -u -c
nuno     29067  0.0  0.2   3216  1800 pts/0    Ss   16:27   0:00 -bash
postfix  22417  0.0  0.2   5880  1772 ?        S    15:39   0:00 pickup -l -t fifo -u -c
postfix  29081  0.0  0.2   5888  1692 ?        S    16:27   0:00 trivial-rewrite -n rewrite -t unix -u -c
postfix  29050  0.0  0.2   5876  1684 ?        S    16:26   0:00 proxymap -t unix -u
nuno     29066  0.0  0.1   8516  1428 ?        S    16:27   0:00 sshd: nuno@pts/0
sphinx   14131  0.0  0.1  16660  1316 ?        S    06:25   0:02 /usr/local/sphinx/bin/searchd --config /usr/local/sphinx/etc/sphinx.conf
root     14266  0.0  0.1  11628  1144 ?        Ss   Oct03   0:00 nginx: master process /usr/sbin/nginx
root      3519  0.0  0.1   5716  1024 ?        S    Sep10   1:42 /usr/sbin/monit -c /etc/monit/monitrc -s /var/lib/monit/monit.state
nuno     29093  0.0  0.1   2480   968 pts/0    R+   16:27   0:00 ps aux --sort -rss
postfix   2935  0.0  0.0   6016   732 ?        S    Sep10   0:10 qmgr -l -t fifo -u
108       2815  0.0  0.0  38128   672 ?        Ssl  Sep10   1:26 /usr/bin/dk-filter -u dk-filter -P /var/run/dk-filter/dk-filter.pid -p inet:8892@localhost -l -d hostname -s /etc/mail/default -S default
ntp       2294  0.0  0.0   4460   636 ?        Ss   Sep10   2:19 /usr/sbin/ntpd -p /var/run/ntpd.pid -g -u 102:104
syslog    2205  0.0  0.0  29596   632 ?        Sl   Sep10   0:44 rsyslogd -c4
root     14229  0.0  0.0  86072   596 ?        Ss   Oct03   0:02 /usr/sbin/varnishd -P /var/run/varnishd.pid -a :6081 -T localhost:6082 -f /etc/varnish/default.vcl -S /etc/varnish/secret -s file,/var/lib/varnish/sirius.hostname/varnish_storage.bin,500M
root         1  0.0  0.0   2732   536 ?        Ss   Sep10   0:04 /sbin/init
postfix   3568  0.0  0.0   6312   504 ?        S    Sep10   0:07 tlsmgr -l -t unix -u -c
root      2139  0.0  0.0   2288   464 ?        Ss   Sep10   0:00 dhclient3 -e IF_METRIC=100 -pf /var/run/dhclient.eth0.pid -lf /var/lib/dhcp3/dhclient.eth0.leases eth0
root      2182  0.0  0.0   5600   376 ?        Ss   Sep10   0:18 /usr/sbin/sshd -D
root      2930  0.0  0.0   5864   348 ?        Ss   Sep10   1:00 /usr/lib/postfix/master
root      2240  0.0  0.0   2428   284 ?        Ss   Sep10   0:15 cron
root      1159  0.0  0.0   2364    96 ?        S<   Sep10   0:00 udevd --daemon
root      1033  0.0  0.0   2368    80 ?        S
~~… and some other with zero values
Mysql configuration:
[mysqld]
user = mysql
pid-file = /var/run/mysqld/mysqld.pid
socket = /var/run/mysqld/mysqld.sock
port = 3306
basedir = /usr
datadir = /srv/mysql
tmpdir = /tmp
language = /usr/share/mysql/english
bind-address = 127.0.0.1
skip-innodb
skip-pbxt
skip-federated
skip-mrg_myisam
back_log = 50
max_connections = 50
key_buffer_size = 80M
myisam_sort_buffer_size = 64M
join_buffer_size = 1M
read_buffer_size = 1M
sort_buffer_size = 2M
table_open_cache = 8000
table_definition_cache = 4000
thread_cache_size = 144
#wait_timeout = 28800
#connect_timeout = 120
#tmp_table_size = 32M
tmp_table_size = 40M
#max_heap_table_size = 32M
max_heap_table_size = 40M
max_allowed_packet = 32M
net_buffer_length = 16384
max_connect_errors = 100000
thread_concurrency = 4
concurrent_insert = 2
table_lock_wait_timeout = 30
read_rnd_buffer_size = 786432
bulk_insert_buffer_size = 8M
query_cache_limit = 1M
query_cache_size = 64M
query_cache_type = 1
query_cache_min_res_unit = 1024
query_prealloc_size = 262144
query_alloc_block_size = 65536
transaction_alloc_block_size = 8192
transaction_prealloc_size = 4096
default-storage-engine = MyISAM
max_write_lock_count = 4
#slow_query_log = 1
#slow_query_log_file = /var/log/mysql/mysql-slow.log
#long_query_time = 3
#log-queries-not-using-indexes = 1
log-error = /var/log/mysql/mysql-error.log
low_priority_updates=1
collation_server=utf8_general_ci
character_set_server=utf8

[mysqld_safe]
nice = -5
open_files_limit = 8192

[mysqldump]
quick
max_allowed_packet = 16M

[myisamchk]
key_buffer_size = 64M
sort_buffer_size = 16M
read_buffer_size = 16M
write_buffer_size = 16M

[mysqlhotcopy]
interactive-timeout
MySQLTuner results:
 >>  MySQLTuner 1.0.1 - Major Hayden <major@mhtx.net>
 >>  Bug reports, feature requests, and downloads at http://mysqltuner.com/
 >>  Run with '--help' for additional options and output filtering
Please enter your MySQL administrative login:
Please enter your MySQL administrative password:

-------- General Statistics --------------------------------------------------
[--] Skipped version check for MySQLTuner script
[OK] Currently running supported MySQL version 5.3.1-MariaDB-beta-mariadb102~luc                                                                             id
[OK] Operating on 32-bit architecture with less than 2GB RAM

-------- Storage Engine Statistics -------------------------------------------
[--] Status: -Archive -BDB -Federated -InnoDB -ISAM -NDBCluster
[--] Data in MyISAM tables: 654M (Tables: 1055)
[--] Data in MEMORY tables: 3M (Tables: 4)
[!!] Total fragmented tables: 17

-------- Performance Metrics -------------------------------------------------
[--] Up for: 2d 4h 6m 14s (1M q [8.835 qps], 121K conn, TX: 11B, RX: 516M)
[--] Reads / Writes: 61% / 39%
[--] Total buffers: 184.0M global + 5.0M per thread (50 max threads)
[OK] Maximum possible memory usage: 435.6M (58% of installed RAM)
[OK] Slow queries: 0% (1/1M)
[OK] Highest usage of available connections: 10% (5/50)
[OK] Key buffer size / total MyISAM indexes: 80.0M/283.5M
[OK] Key buffer hit rate: 99.4% (64M cached / 398K reads)
[OK] Query cache efficiency: 32.0% (290K cached / 909K selects)
[OK] Query cache prunes per day: 0
[OK] Sorts requiring temporary tables: 0% (10 temp sorts / 56K sorts)
[OK] Temporary tables created on disk: 9% (2K on disk / 26K total)
[OK] Thread cache hit rate: 99% (5 created / 121K connections)
[!!] Table cache hit rate: 3% (158 open / 4K opened)
[OK] Open file limit used: 1% (290/16K)
[OK] Table locks acquired immediately: 99% (1M immediate / 1M locks)

-------- Recommendations -----------------------------------------------------
General recommendations:
    Run OPTIMIZE TABLE to defragment tables for better performance
    Enable the slow query log to troubleshoot bad queries
    Increase table_cache gradually to avoid file descriptor limits
Variables to adjust:
    table_cache (> 8000)</major@mhtx.net>
I'm uging nginx + apache + varnish + mariadb.
Should I do any optimization? Where?
Thanks~~~~
7 Replies
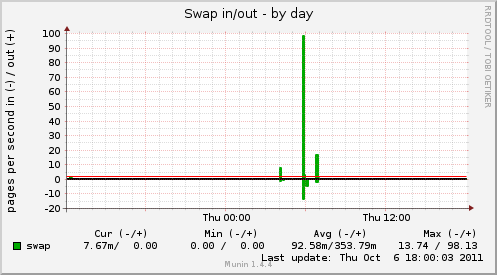
If you see something like this:
 ~~
~~
… you may have a problem.
But if it's flat (or very close to zero), it's not a problem. Swap is all about the rate.
As usual, double-check to make sure your Apache's MaxClients is set to something reasonable… since it's third in line, it probably doesn't need to be much higher than 5 or so.
Nothing jumps out in the MySQ--err, MariaDB config, although it looks like you're using MyISAM as a storage engine, which is often a bad idea unless you have a specific reason to do so. Not a memory-usage concern, per se, but you will very likely lose data in the event of a crash or if things go pear-shaped and oom-killer decides to kill MariaDB.
If there is a crunch, tweaking Varnish to use less RAM (or ditching it and using nginx's caching where you need it) would be the first place I'd go.~~
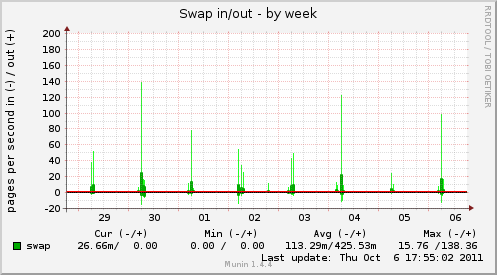
Thanks for you time.
My year swap usage looks lie this:
 ~~
~~
This is my main apache config:
Timeout 50
KeepAlive Off
MaxKeepAliveRequests 100
KeepAliveTimeout 5
 <ifmodule mpm_prefork_module="">StartServers           3
    MinSpareServers        3
    MaxSpareServers        3
    ServerLimit           30
    MaxClients            25
    MaxRequestsPerChild  100</ifmodule>
I think I can lower Maxclients … do you have any advice?
Regarding MariaDB, I tested MySQL INNODB but i got scared about memory usage so I roll back to MyISAM … I can try again.
I would like to use only nginx cache, but I use ESI in varnish and I haven't read about nginx purge yet … varnish is easy.
Thanks again
I haven't played around with ESI yet (or Varnish beyond some light testing)… most of the caching is done by our framework, so the only things I cache downstream are RSS feeds, sitemaps, etc. (The framework invalidates cached data when it should, which is good, it's just that sitemaps take so long to build.) But nginx isn't a web cache, in the same way that Varnish isn't a web server, so if you need a web cache…
 ~~
~~
 ~~
~~